Diagram is a line drawing that shows how the number of subscriptions/subscribers changes during a selected period of time. The smallest division on a value axis is one day.
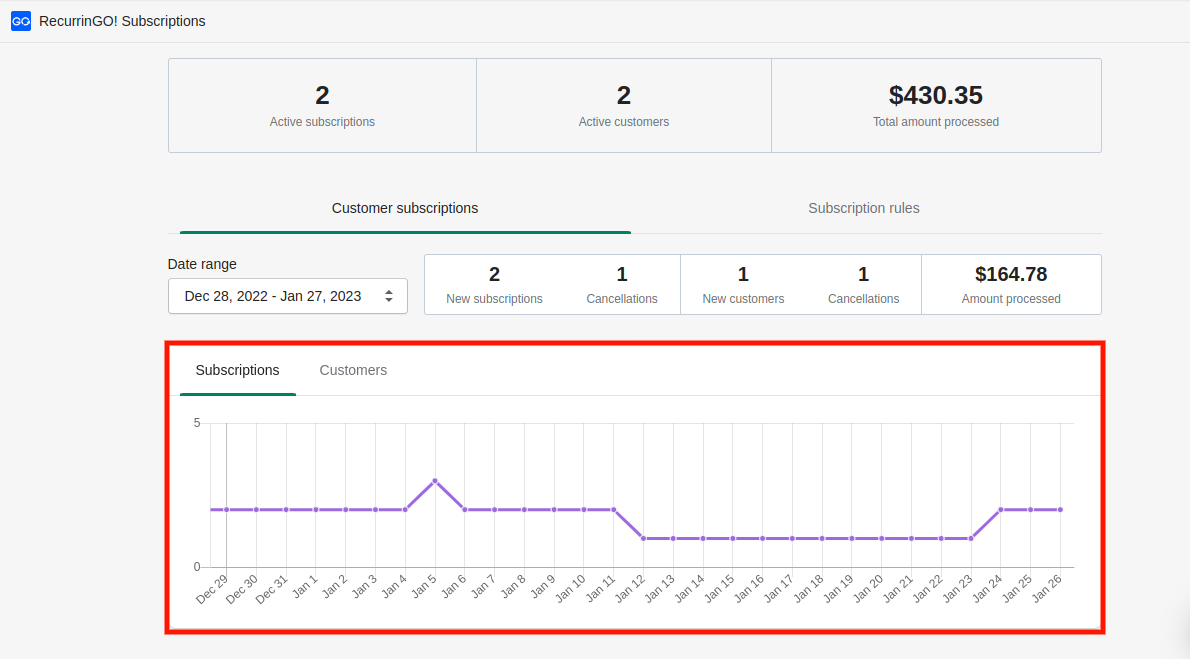
Diagram is a line drawing that shows how the number of subscriptions/subscribers changes during a selected period of time. The smallest division on a value axis is one day.